Project Length: 3 weeks
Tools: D3.js
Team Member: Neil Bantoc
Motivation
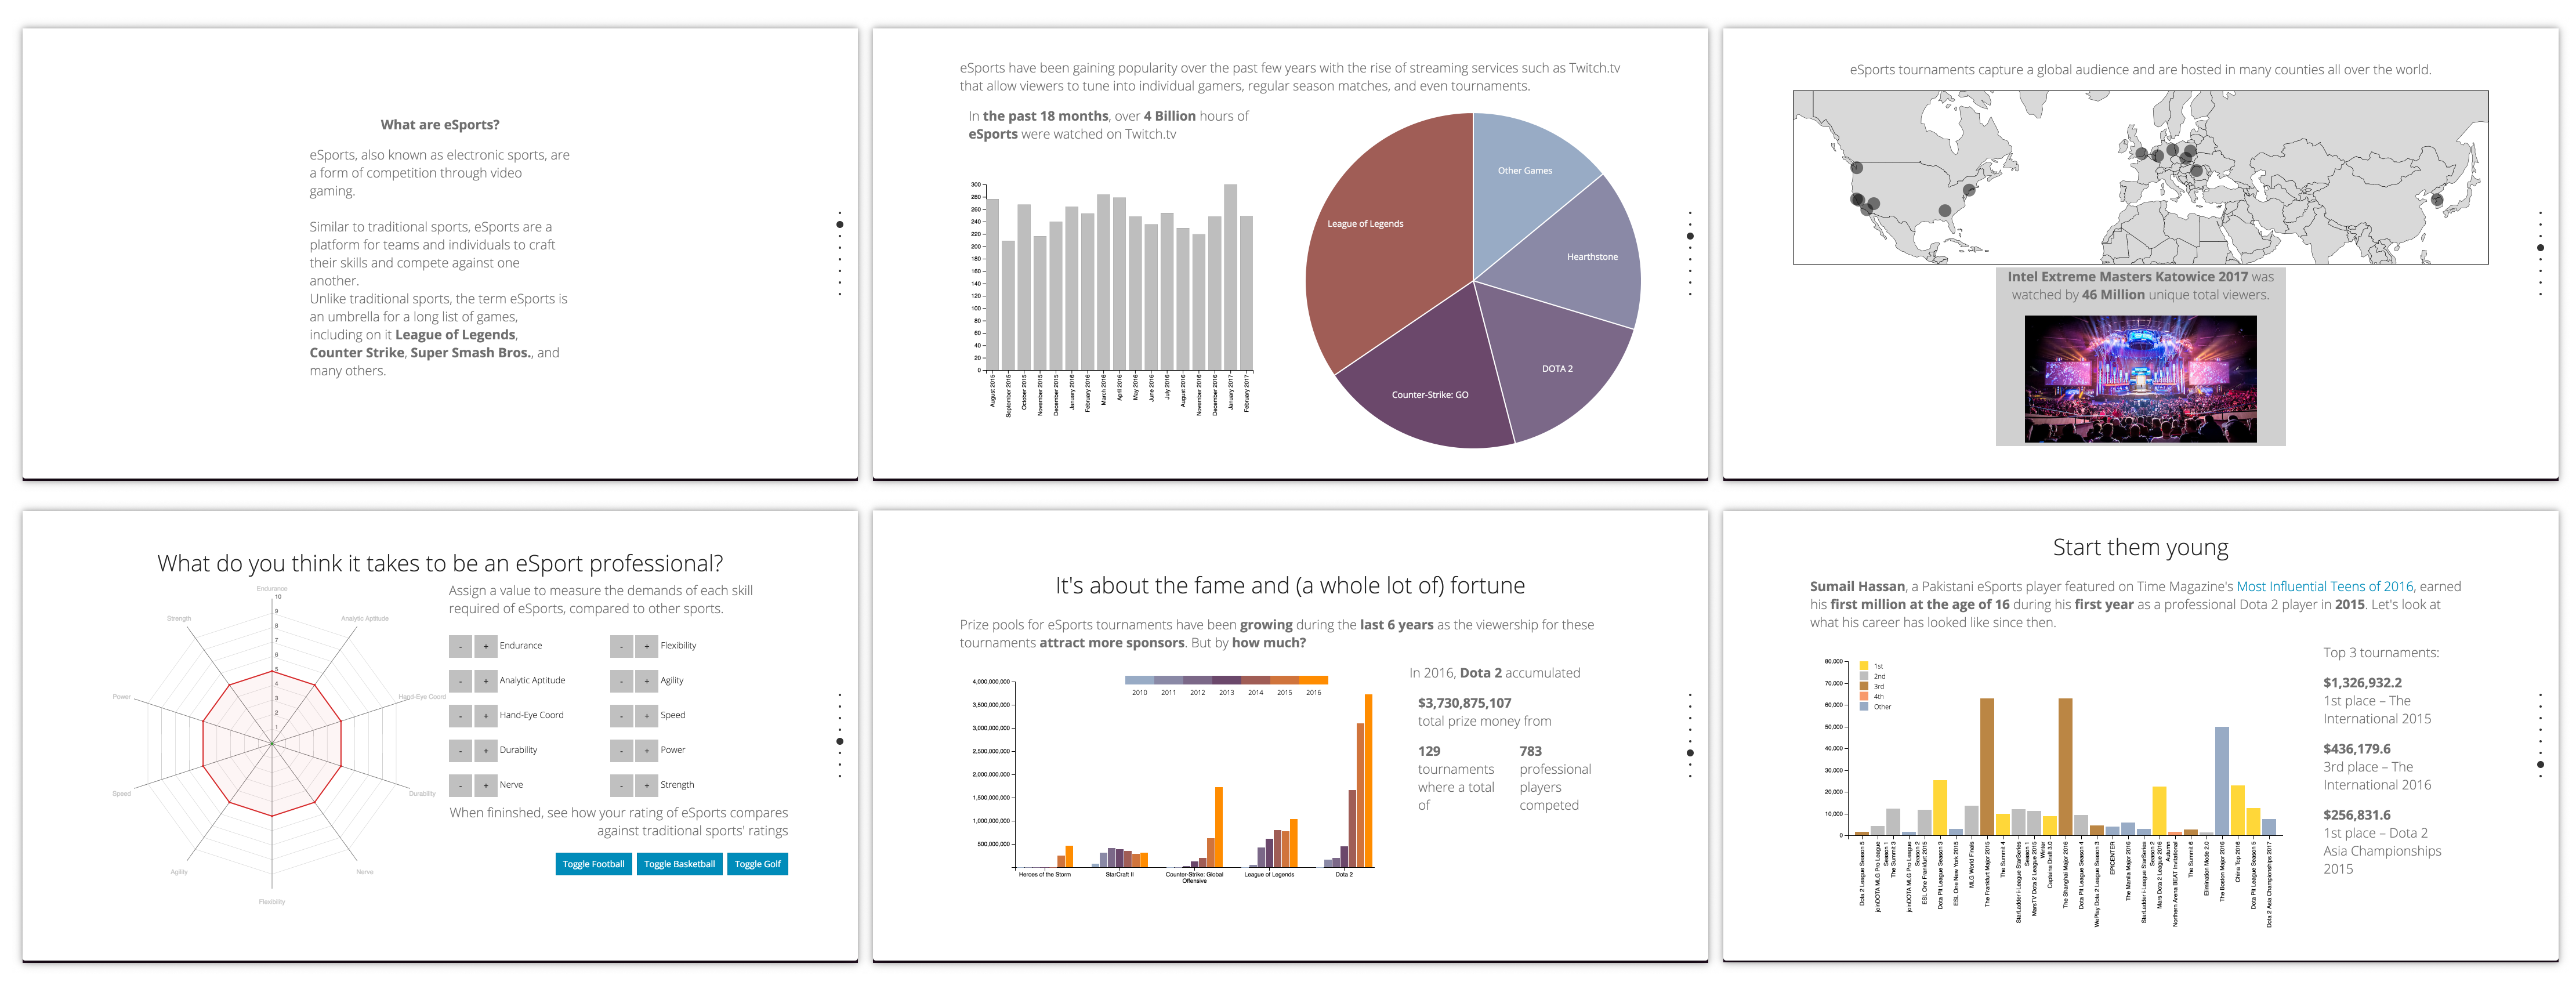
The motivation behind this project came out of the desire to explore the growth and popularity of eSports. There are a handful of articles floating around that claim eSport viewership has surpassed that of traditional sports. While our team enjoys playing and following many competitive video games, we were skeptical of these claims and wanted to discover the actual numbers behind the sport. This project then became an opportunity to show off the data we uncovered in appealing and interactive ways.
Process
Our team initially set out to answer the questions: how does the popularity of eSports compare to traditional sports? We believe that by comparing eSports against sports such as football and basketball, our audience would have a better context of how to think about electronic gaming.
Data Collection
We began with broad data collection relating to eSport viewership, tournament prize pools, and player salaries. Additionally, we gathered traditional sporting viewership in an effort to compare them and eSports. We turned to Twitch.tv to collect eSport viewership data, and to Nielsen for traditional sport viewership data. In this process, we discovered the way viewership is measured for eSports is fundamentally different than the way it is measured for sports such as basketball, football, and baseball. In the case of more traditional sports, viewership is subject to the Nielsen guidelines, where as eSports is not.
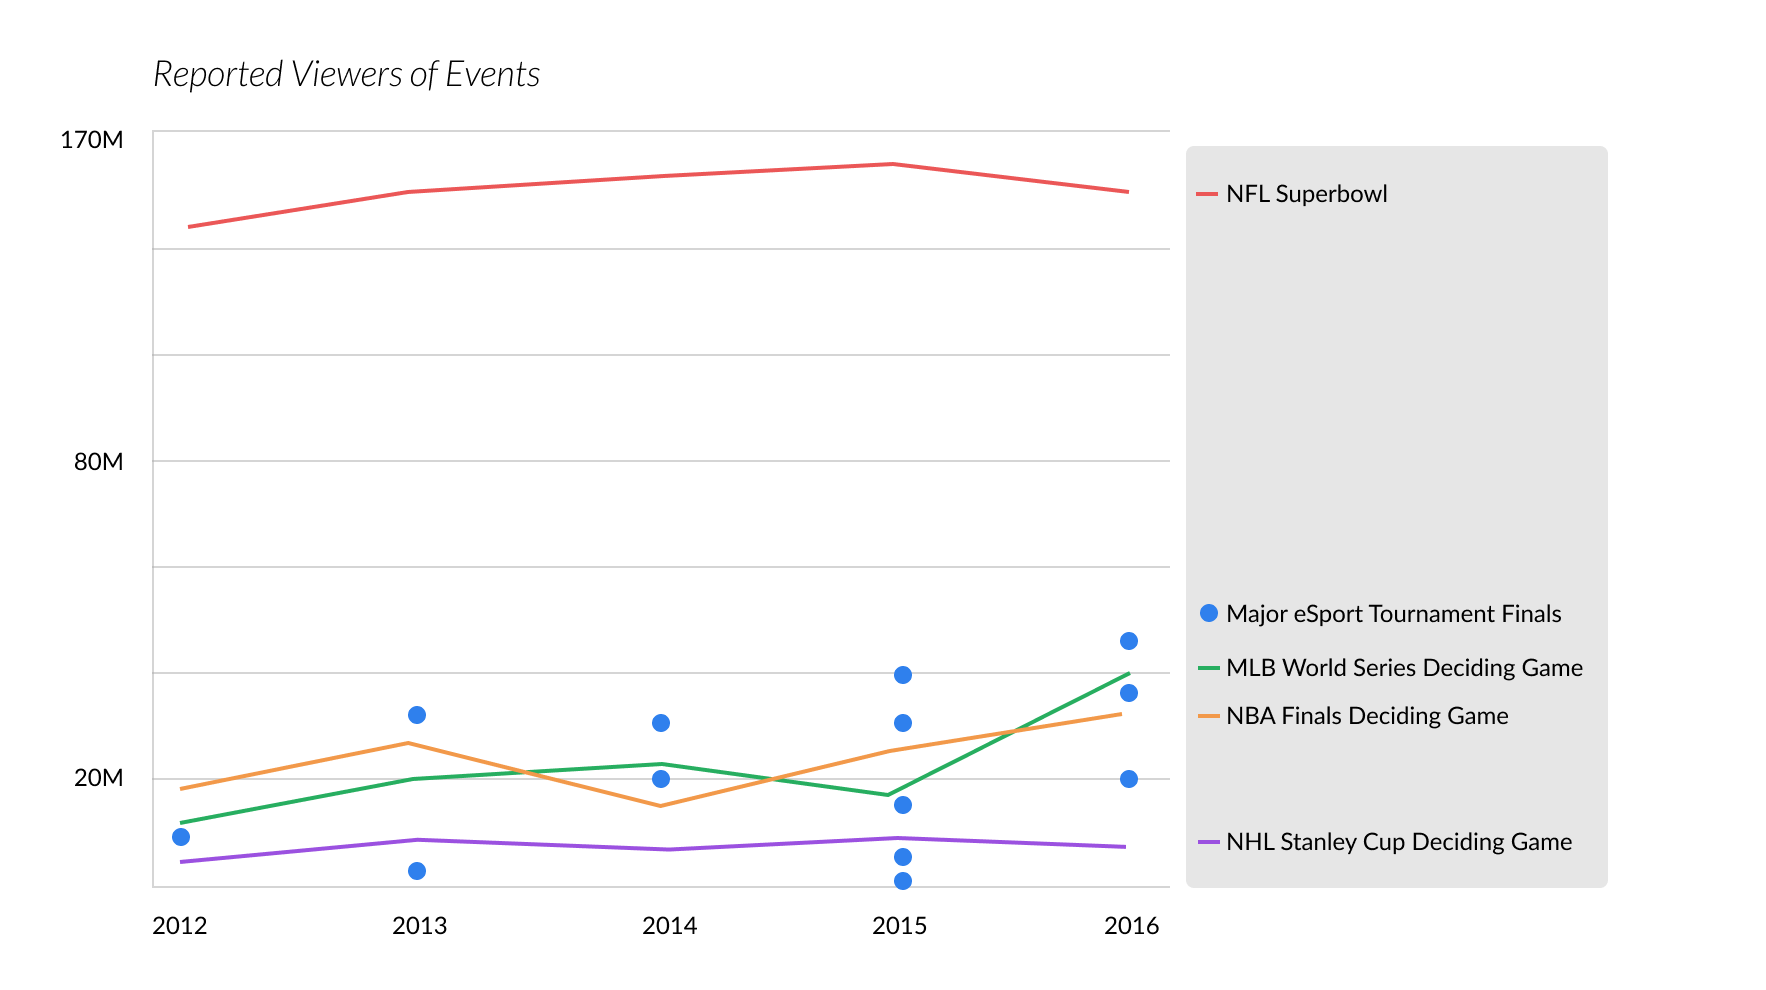
This means that viewership for traditional sports are measured by the average number of people who watch an entire event, but viewership for eSports is generally measured as the total number of people tuned in at any point of an event.
This realization pivoted certain aspects of our project to focus more on comparing the qualitative measurements of traditional sports and eSports rather than comparing quantitative viewership.
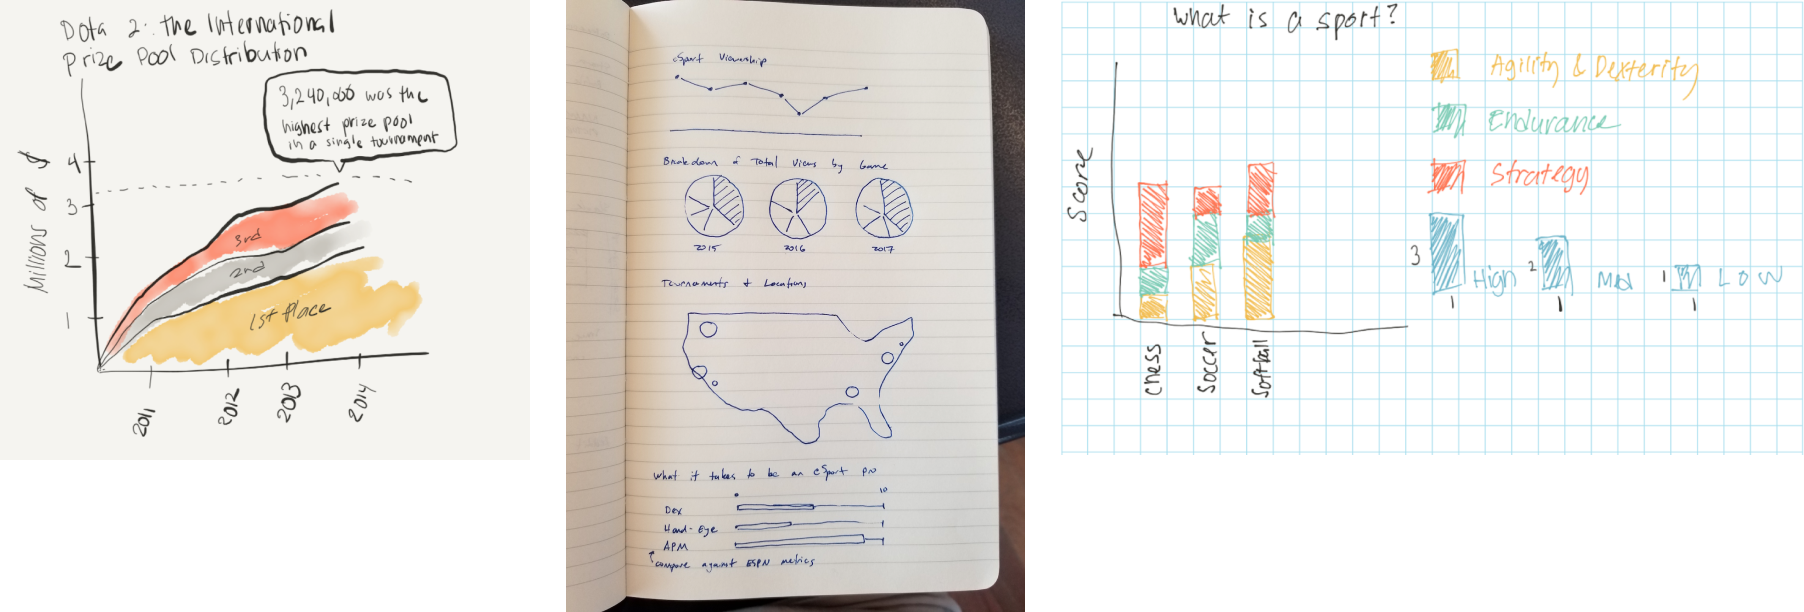
Initial Sketching
Once we collected the data, we began exploring the ways in which we could represent it all through a compelling and cohesive narrative. We sketched our initial ideas onto paper, and rearranged them in different ways to see how the story it told as a whole changed.
Making it Interactive
To allow others the ability to engage with our visualizations and explore the data we gathered, we used D3.js to make each display interactive. Check out the full suite of interactions at the live site here.
Check out my other projects!